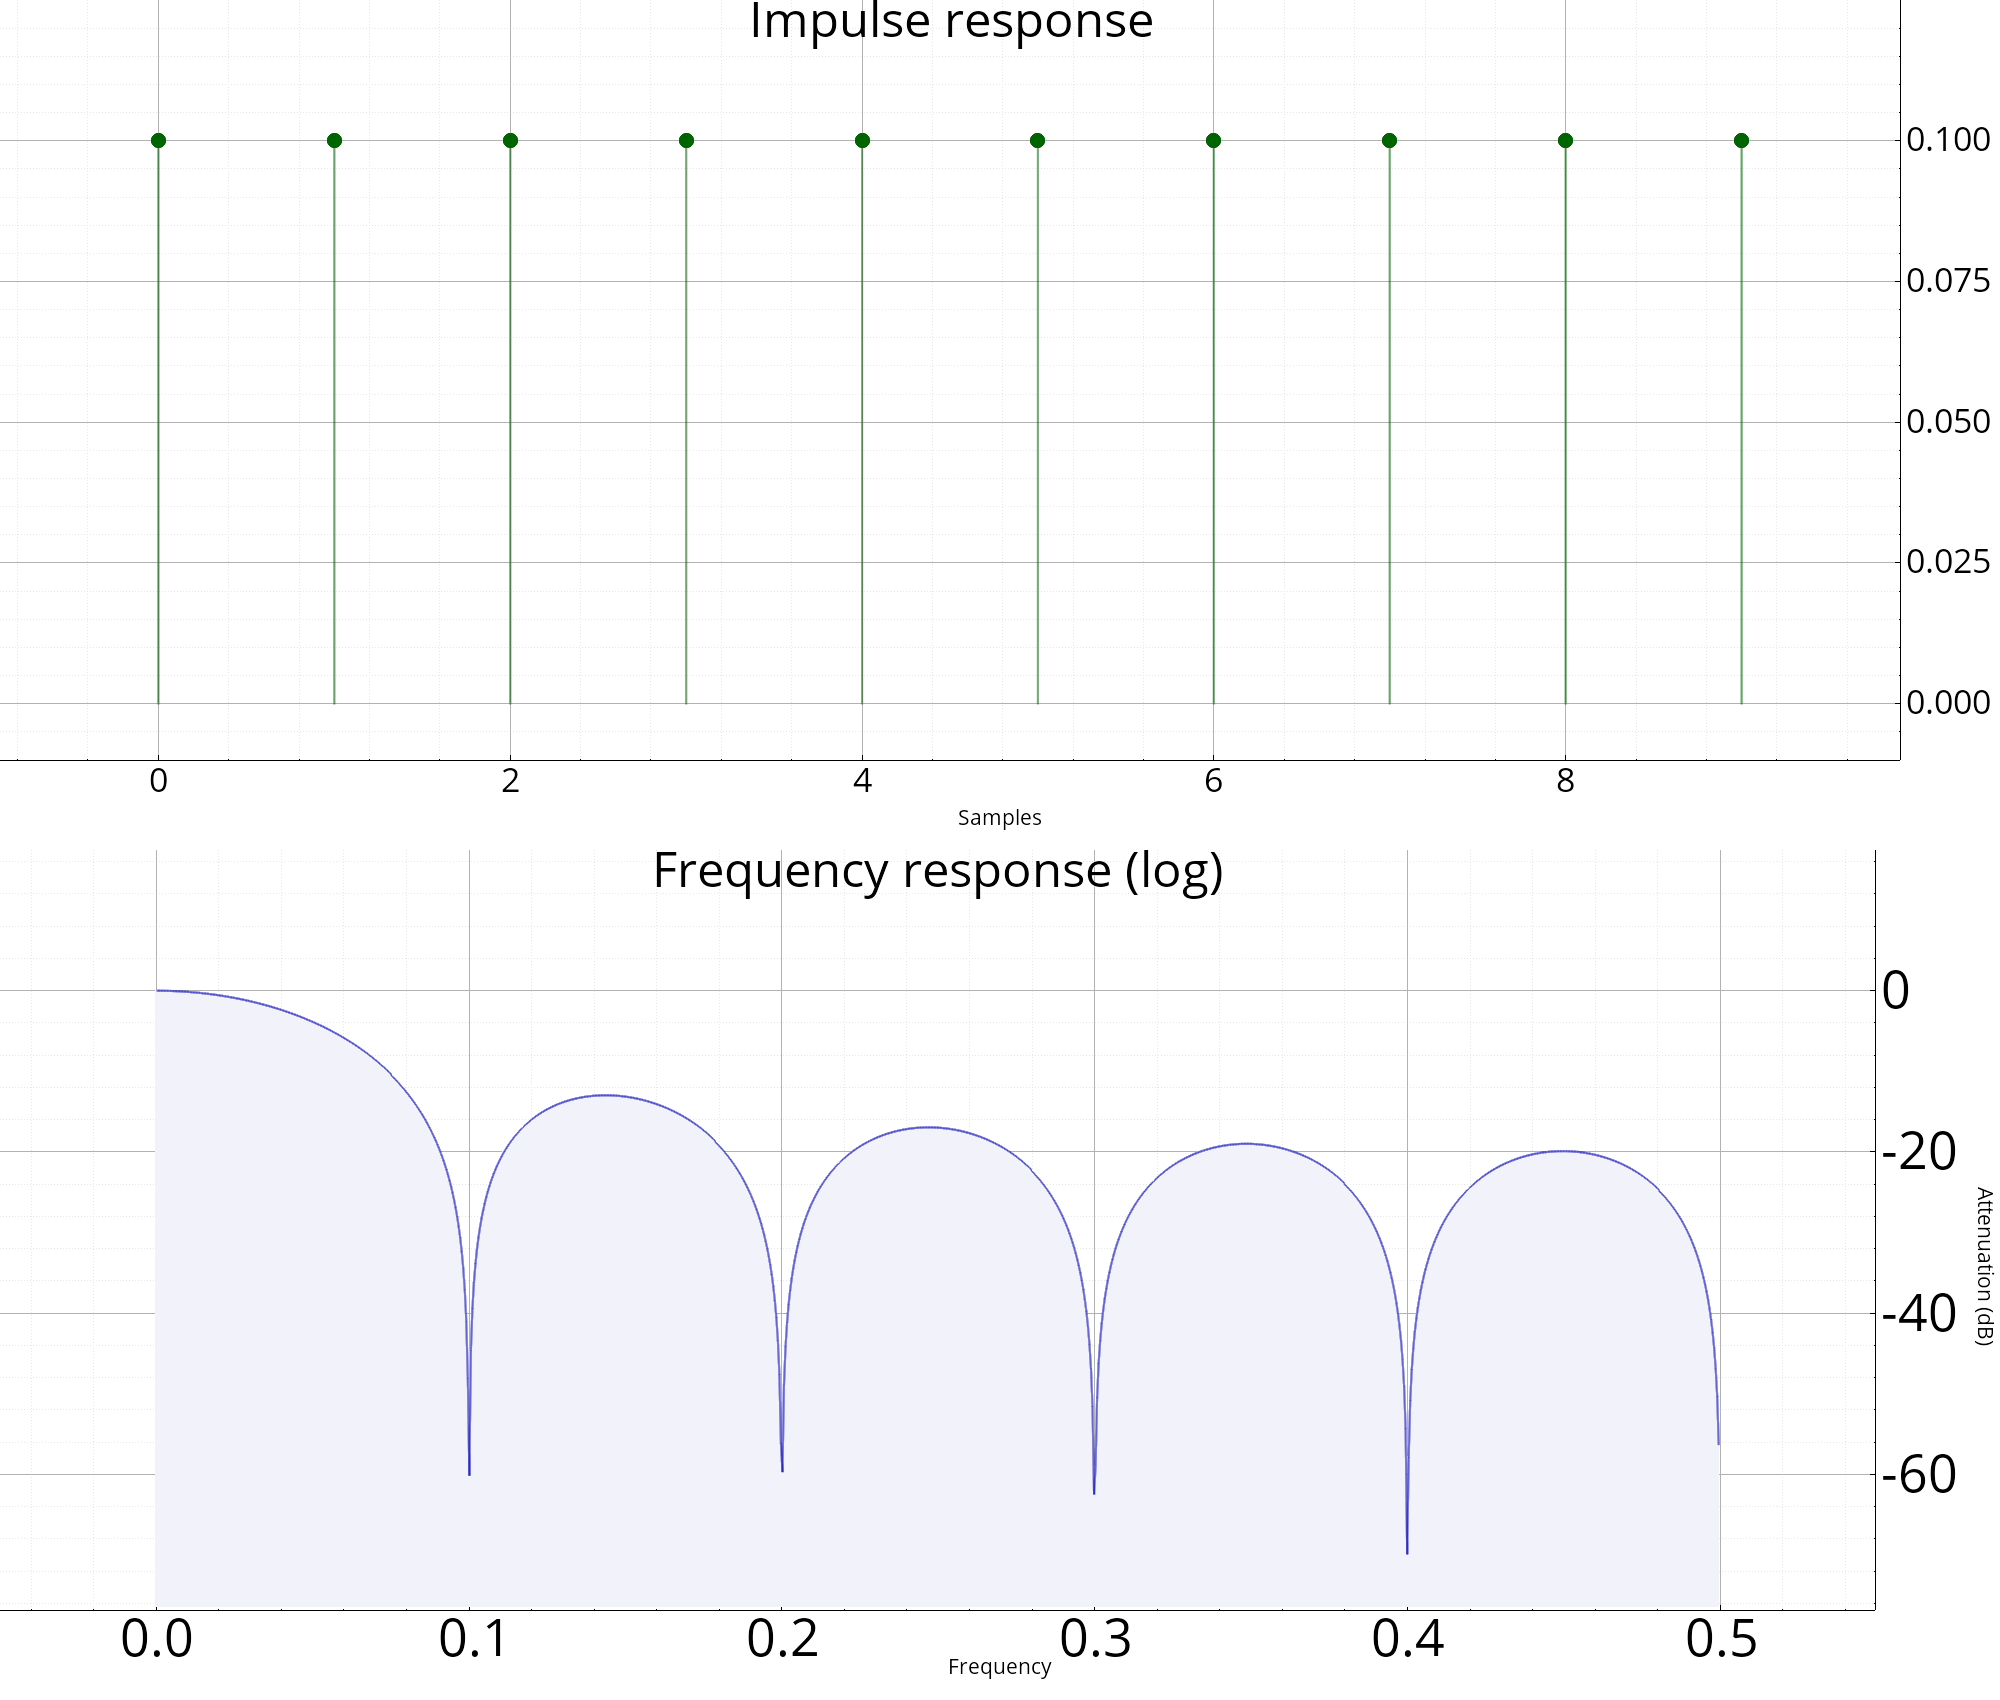
plot_filter
Analysis of a linear filter (plot the different responses).
Namespace: dsp::filter
Prototype
dsp::view::Figures dsp::filter::plot_filter(const FRat<T> &h, bool complete=false, float fs=1)
Parameters
| h | Transfert function to be analyzed. |
| complet | If true, display all the responses (impulse, poles and zeros, etc.). Otherwise, displau only the the frequency response (in magnitude). |
| fs | Sampling frequency. |
Returns
The new figure.
Description
This function build a new figure, and plots the frequency and time response of the filter, alongside with the zeros / poles diagram.
Example

