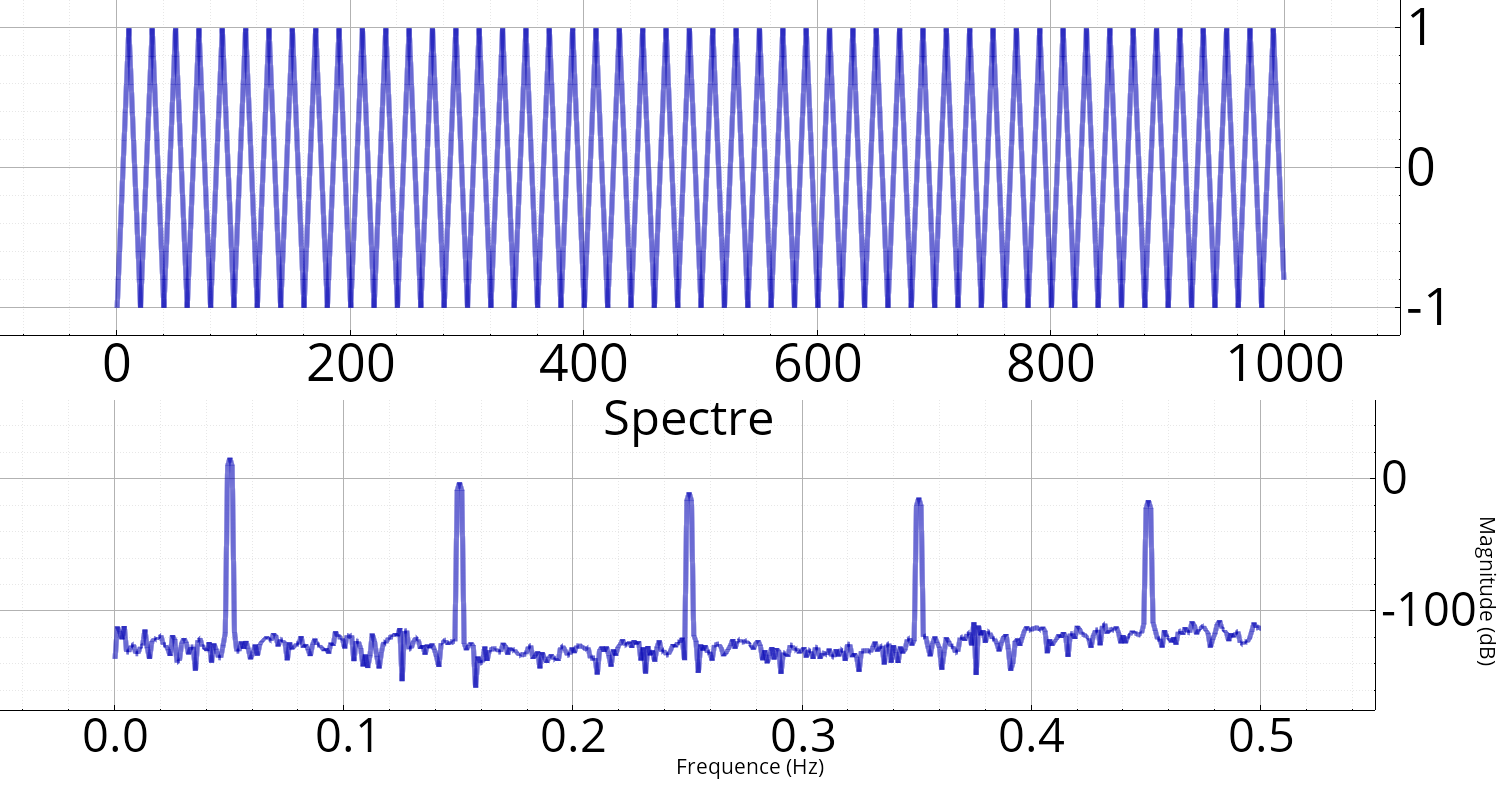
psd
PSD (correlogram).
Namespace: dsp::fourier
Prototype
tuple<Vecf, Vecf> psd(const Vector<T> &x)
Parameters
| x | Signal to be analyzed. |
Returns
A tuple with two elements: frequences vectors (normalized, between -0.5 and 0.5), and the spectrum.
Description
Computes the correlogram using a Hann window:
The resulting spectrum is 0 Hz centered (frequency vector: linspace(-0.5,0.5-1.0/N,N)).
Example

PSD signal triangulaire
