plot_plz (1)
Poles / zeros diagram.
Prototype
void plot_plz(Figure &fig, const FRat<T> &h, bool cmap=false)
Parameters
| fig | Figure where to plot the zeros and poles. |
| h | transfert function |
| cmap | If true, draw a color map representing the magnitude of the response in the complex plane. |
Description
The transfert function is factored as:
where the \(z_i\) and \(p_i\) are called respectively the zeros et poles.
Example
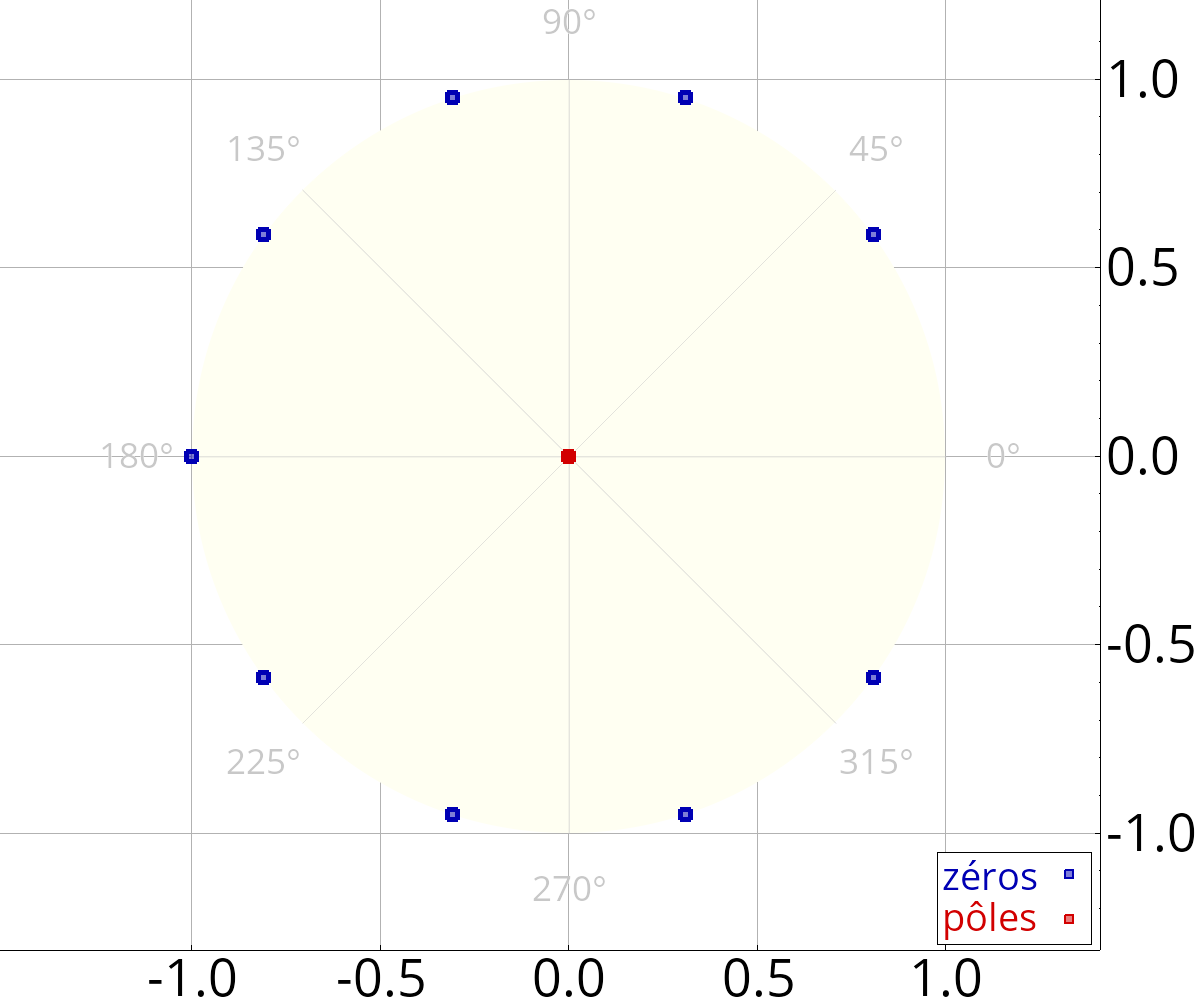
With cmap=false
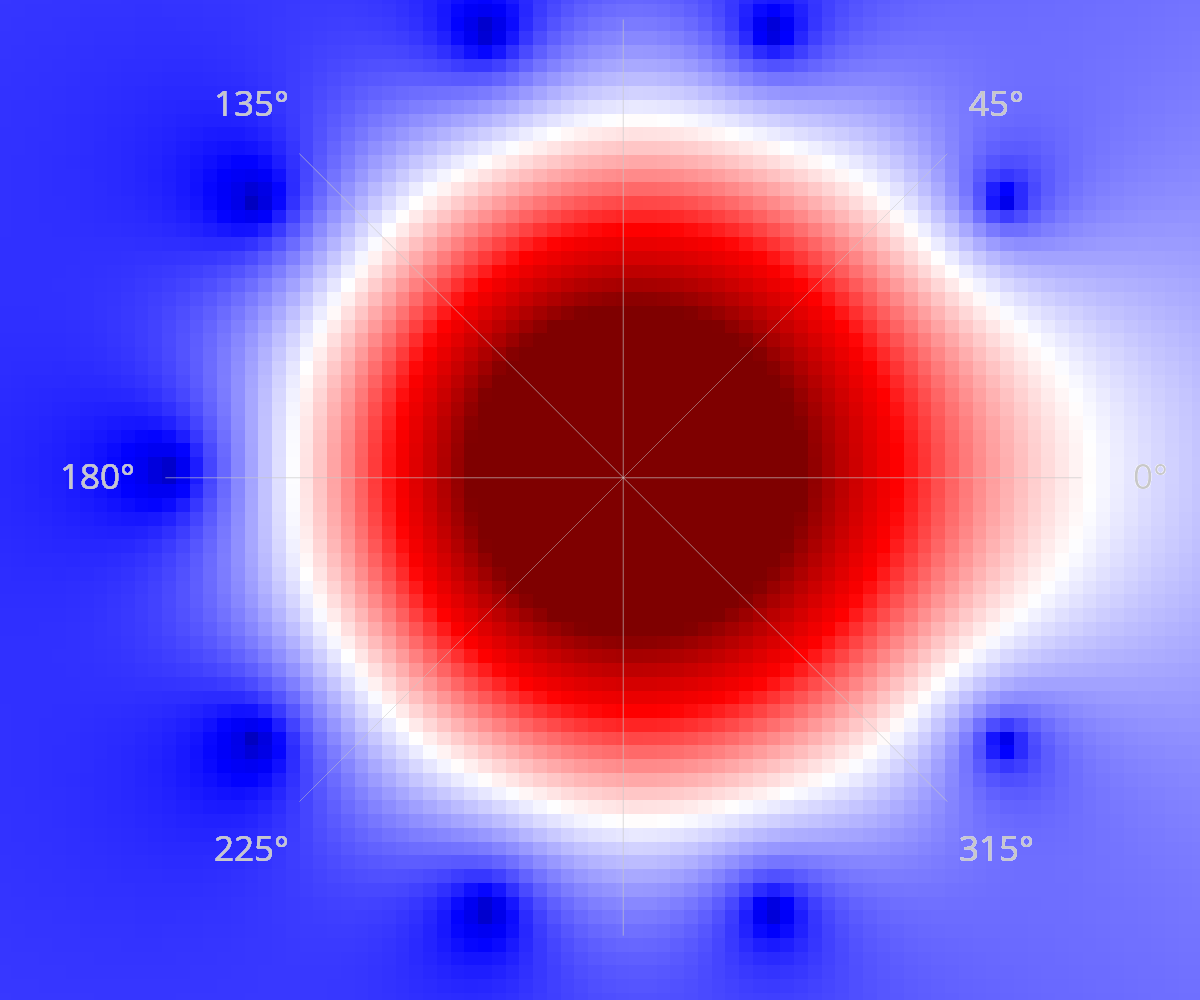
With cmap=true